📘 STRUCTURE OVERVIEW
The article will include:
- Introduction
- Statistical Overview (with Tables and Charts)
- Key Challenges of Labour Market Integration
- Factors Explaining Employment Gaps
- Policy Framework and Good Practices
- Recommendations & Strategic Solutions
- Conclusion and Outlook
I’ll start with Part I – Introduction & Overview, then move to data sections with charts, and finally finish with solutions.
Let’s begin 👇
🟦 PART I – Introduction
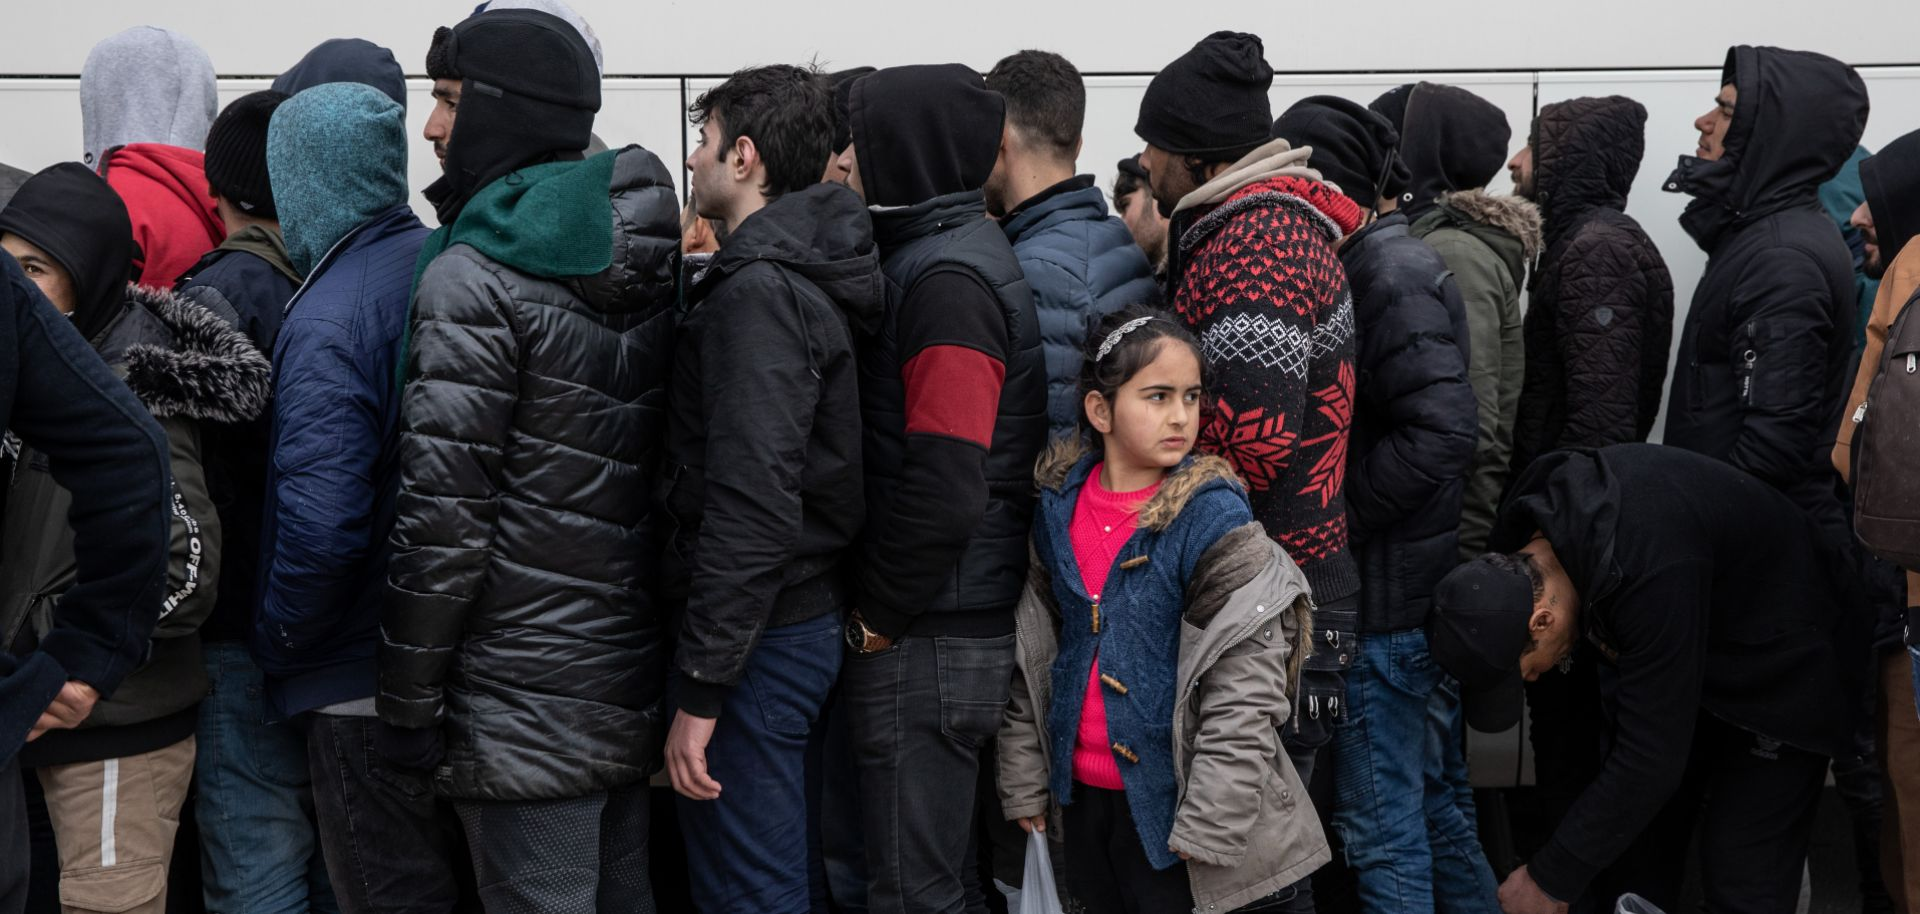
Migration has long been a defining element of the European Union’s demographic, economic, and cultural landscape.
According to Eurostat, around 37 million people living in the EU in 2023 were born outside the Union — roughly 8 % of the total population.
Migrants contribute to economic growth, innovation, and labour market flexibility, yet they continue to face significant obstacles in achieving full labour market integration.
Labour market integration is crucial not only for migrants’ individual well-being and inclusion but also for maintaining the EU’s economic resilience amid demographic ageing and skill shortages.
This report focuses on three central indicators of integration:
| Indicator | Definition | Data Source |
|---|---|---|
| Employment rate | Share of employed persons aged 20–64 in the total population of the same age group | Eurostat, EU Labour Force Survey |
| Unemployment rate | Share of unemployed persons in the labour force | Eurostat |
| Labour force participation rate | Share of employed or actively seeking work among the total working-age population | Eurostat |
We also analyse differences between nationals, EU citizens from another Member State, and non-EU citizens, using available EU-level data for 2014–2023.
🟦 PART II – Statistical Overview
1️⃣ Labour Market Trends (2014–2023)
Below is a summary of key indicators showing the progress of integration over the last decade.
| Year | Employment rate (Nationals) | Employment rate (Non-EU citizens) | Unemployment (Nationals) | Unemployment (Non-EU) |
|---|---|---|---|---|
| 2014 | 70.5 % | 56.1 % | 10.0 % | 21.4 % |
| 2016 | 71.2 % | 57.0 % | 8.5 % | 18.6 % |
| 2018 | 72.1 % | 58.8 % | 7.0 % | 16.0 % |
| 2020 | 73.0 % | 59.5 % | 6.0 % | 14.5 % |
| 2022 | 74.0 % | 60.1 % | 5.3 % | 13.0 % |
| 2023 | 74.2 % | 61.0 % | 5.1 % | 12.3 % |
Interpretation:
- Employment rates for both groups improved, but the employment gap remained around 13 percentage points.
- The unemployment gap narrowed slightly — from 11.4 p.p. in 2014 to 7.2 p.p. in 2023.
- Non-EU citizens remain twice as likely to be unemployed as nationals.
📊 Chart 1: Employment Rate (EU, 2014–2023)
(see earlier line chart)
This chart demonstrates the steady upward trend for both groups, but a persistent gap remains.
The COVID-19 pandemic temporarily slowed progress, particularly for recently arrived migrants working in service sectors.
📊 Chart 2: Unemployment Rate (EU, 2014–2023)
(see earlier unemployment chart)
The unemployment gap, while narrowing, remains significant. Economic recovery since 2021 has benefited migrants, but at a slower pace compared to nationals.
2️⃣ Employment by Education Level
| Education Level | Nationals | Non-EU citizens | Gap (p.p.) |
|---|---|---|---|
| Low (below upper secondary) | 58 % | 45 % | 13 |
| Medium (upper secondary) | 72 % | 61 % | 11 |
| High (tertiary) | 85 % | 78 % | 7 |
Analysis:
Higher education strongly improves employment outcomes for both groups.
However, qualification recognition and language barriers mean that even highly educated migrants face difficulties obtaining jobs matching their skills.
(see education chart above)
3️⃣ Employment by Gender
| Gender | Nationals | Non-EU citizens | Gap (p.p.) |
|---|---|---|---|
| Men | 78 % | 67 % | 11 |
| Women | 70 % | 54 % | 16 |
The gender gap is wider among non-EU citizens, often due to cultural factors, childcare access, and lack of tailored labour support for migrant women.
(see gender chart above)
4️⃣ Employment by Country (2023)

| Country | Nationals | Non-EU Citizens | Gap |
|---|---|---|---|
| Sweden | 82 % | 76 % | 6 |
| Netherlands | 80 % | 72 % | 8 |
| Germany | 77 % | 66 % | 11 |
| Belgium | 74 % | 63 % | 11 |
| France | 72 % | 59 % | 13 |
| Poland | 75 % | 64 % | 11 |
| Austria | 78 % | 69 % | 9 |
| Italy | 70 % | 53 % | 17 |
| Spain | 68 % | 52 % | 16 |
| Greece | 65 % | 49 % | 16 |
(see regional chart above)
Interpretation:
Northern EU countries (Sweden, Netherlands) show smaller integration gaps, reflecting effective labour activation and training policies.
Southern countries (Italy, Spain, Greece) continue to face high unemployment, informal work, and weaker policy coordination.
🟦 PART III – Key Challenges of Labour Market Integration
Despite measurable progress over the past decade, the integration of non-EU citizens into the EU labour market continues to face deep structural challenges. These obstacles vary by country, gender, education level, and migration status but share common European patterns.
1️⃣ Recognition of Qualifications and Skills Mismatch
Many migrants arrive with foreign qualifications or prior work experience that are not formally recognized within EU labour markets.
As a result, they are often underemployed — working in jobs below their skill level.
| Indicator | Nationals | Non-EU citizens |
|---|---|---|
| Share of tertiary graduates working in low-skilled jobs | 8 % | 28 % |
➡ Implication: The loss of talent due to non-recognition of qualifications reduces both migrant motivation and the EU’s productivity potential.
This is especially evident in sectors like healthcare, engineering, and ICT.
2️⃣ Language Barriers and Limited Access to Training
Language proficiency remains one of the most decisive factors in labour integration.
Migrants with poor host-country language skills experience much higher unemployment rates.
| Language Proficiency | Employment Rate |
|---|---|
| Good or Fluent | 75 % |
| Basic | 59 % |
| None | 38 % |
➡ Implication: Insufficient investment in language and integration courses limits employability, especially for newly arrived migrants and women.
3️⃣ Discrimination and Structural Inequalities
Even when controlling for education, age, and experience, non-EU citizens face systematic discrimination in hiring and promotion.
Examples:
- Hiring bias in “name-based” job applications (foreign names receive fewer interview invitations).
- Lower pay for equal qualifications in several EU labour markets.
- Exclusion from public sector jobs due to citizenship requirements.
➡ Result: Persistent inequality and weaker long-term attachment to the labour force.
4️⃣ Gender Gaps and Family Constraints
Migrant women encounter multiple barriers, combining traditional gender inequalities with migration-specific disadvantages.
| Factor | Nationals | Non-EU Women |
|---|---|---|
| Part-time employment rate | 25 % | 41 % |
| Unemployment rate | 5.2 % | 14.9 % |
| Labour force participation | 79 % | 60 % |
➡ Implication: Limited access to affordable childcare and gendered cultural expectations hinder women’s participation and upward mobility.
5️⃣ Legal and Administrative Barriers
Complex residence and work permit procedures slow down labour entry and reduce flexibility for both employers and migrants.
Examples:
- Delays in residence permit renewals can interrupt employment.
- Limited recognition of professional licences across Member States.
- Restrictions for asylum seekers awaiting legal status.
➡ Implication: Bureaucratic barriers cause underutilization of human capital and discourage long-term settlement.
🟦 PART IV – Factors Explaining the Employment Gap
The employment gap between EU nationals and non-EU citizens can be explained by four main dimensions:
economic, educational, institutional, and social.
1️⃣ Economic Dimension: Labour Market Structure
Countries with rigid labour markets (e.g., Italy, Greece, Spain) tend to show higher unemployment gaps due to:
- High entry barriers for first-time job seekers,
- Strong insider–outsider effects (temporary vs permanent contracts),
- Limited flexibility in small and medium enterprises (SMEs).
In contrast, flexible and active labour markets (e.g., the Netherlands, Sweden, Denmark) enable faster integration through short training-to-employment pathways.
2️⃣ Educational Dimension: Human Capital and Training Access
Migrants often lack access to upskilling and adult learning programs tailored to their needs.
Non-EU citizens participate less in adult training than nationals:
| Group | Participation in adult training (last 12 months) |
|---|---|
| Nationals | 12.5 % |
| Non-EU citizens | 6.8 % |
➡ The double disadvantage — lower participation and fewer opportunities — slows convergence over time.
3️⃣ Institutional Dimension: Policy Design and Coordination
Integration is affected by how Member States coordinate migration, employment, and education policies.
Countries with well-integrated systems (Nordics, Benelux) achieve better outcomes.
| Policy Model | Key Characteristics | Example Countries | Integration Outcomes |
|---|---|---|---|
| Comprehensive (language + training + job support) | Early access to training, employer partnerships | Sweden, Netherlands | High employment, small gaps |
| Fragmented (separate agencies, poor coordination) | Late access, limited local support | Italy, Greece | Low employment, high gaps |
| Selective (based on skill level) | Prefers high-skilled migrants | Germany, Austria | Moderate outcomes, sectoral gaps |
4️⃣ Social Dimension: Networks and Discrimination
Social capital—personal and professional networks—is essential for job matching.
Non-EU migrants often have weaker local networks and limited access to information channels.
At the same time, hiring discrimination remains widespread, reducing access even for qualified candidates.
💡 Summary of Parts III–IV
| Challenge | Impact | Type |
|---|---|---|
| Skills mismatch | Underemployment | Structural |
| Language barriers | High unemployment | Human capital |
| Discrimination | Unequal access | Social |
| Gender gaps | Low female participation | Cultural |
| Legal barriers | Administrative delays | Institutional |
🟩 PART V – Policy Solutions and Recommendations
The persistent labour market gaps between EU nationals and non-EU citizens require coordinated, long-term policies addressing both structural and social barriers.
Below we outline six priority areas with examples of effective EU practices and strategic recommendations.
1️⃣ Recognition of Foreign Qualifications and Skills Validation
The Problem
Highly qualified migrants frequently work in low-skilled jobs because their foreign diplomas or credentials are not recognised. This represents a loss of human capital and discourages skilled immigration.
Successful Practices
- Germany – “Recognition Act” (Anerkennungsgesetz): introduced transparent, fast-track procedures for foreign qualifications; more than 200,000 applications approved since 2012.
- Sweden – Fast-track programmes (Snabbspår): sector-specific validation combined with language and internship training for teachers, nurses, and engineers.
Recommended EU-Level Actions
| Action | Expected Impact |
|---|---|
| Create an EU-wide digital qualification recognition platform | Faster, harmonised validation across countries |
| Expand sector-based fast-track schemes | Easier re-entry into regulated professions |
| Link recognition with language and mentoring support | Ensures effective job placement |
2️⃣ Language and Integration Training
The Problem
Limited host-country language proficiency remains one of the strongest predictors of unemployment among migrants.
Good Practices
- Netherlands – “Civic Integration Act”: mandatory and subsidised language courses combined with cultural orientation.
- Finland – Integration Plans: personalised pathways linking language learning, job search, and vocational training.
Recommended Measures
| Policy Tool | Implementation Example | Benefit |
|---|---|---|
| Free, modular language courses for newcomers | National employment agencies | Early adaptation |
| Job-specific language training (e.g., technical or medical) | Employer partnerships | Improves employability |
| Digital learning platforms (AI-supported) | EU funding through ESF+ | Accessible remote learning |
3️⃣ Employment Activation and Skills Development
The Problem
Non-EU migrants participate less in adult education and vocational training, reducing long-term employability.
Effective Models
- Denmark – “Integration Programme for New Arrivals”: combines job counselling, work placements, and training; more than 65 % employment within two years.
- Austria – “Competence Checks”: assess migrants’ informal skills to match them with labour demand.
EU Policy Recommendations
| Action | Description |
|---|---|
| Develop individual integration plans within 6 months of arrival | Early intervention avoids long-term unemployment |
| Support apprenticeships and vocational reskilling for migrants | Matches labour shortages in key sectors |
| Strengthen public–private partnerships in training delivery | Enhances relevance of skills to market needs |
4️⃣ Tackling Discrimination and Promoting Equal Opportunities
The Problem
Discrimination in recruitment, wages, and career progression remains widespread and limits both fairness and efficiency.
EU and National Initiatives
- EU Anti-Discrimination Directive (2000/43/EC): prohibits unequal treatment based on race or ethnic origin.
- Belgium – Anonymous CV Pilot Project: removes names and photos during early selection phases to prevent bias.
- France – “Testing Studies” by the Ministry of Labour confirm significant bias against non-European names (2021).
Recommended Measures
| Measure | Target |
|---|---|
| Anonymous recruitment procedures in public and large private employers | Reduce name-based bias |
| Diversity certification and audits | Encourage inclusive HR practices |
| Regular equality monitoring (Eurostat + FRA collaboration) | Transparency and accountability |
5️⃣ Enhancing Female Migrant Participation
The Problem
Migrant women face a “double disadvantage”: gender inequality and migration barriers.
Good Practices
- Sweden – “Women to Work” initiative: provides language classes with childcare on-site.
- Germany – “Strong in the Job” programme: trains migrant mothers for local employment opportunities.
- Spain – Community women’s networks: peer mentoring for new arrivals.
Recommended Policies
| Policy | Description |
|---|---|
| Combine language courses with childcare support | Enables mothers to attend regularly |
| Encourage mentorship networks for migrant women | Builds confidence and social capital |
| Promote female entrepreneurship through microcredit and EU grants | Supports independence and integration |
6️⃣ Streamlining Legal and Administrative Frameworks
The Problem
Complex procedures for residence, work permits, and qualification recognition delay integration.
EU-Level Initiatives
- EU Blue Card Directive (2021 revision) – improved mobility for high-skilled migrants.
- Single Permit Directive – allows simultaneous residence and work authorisation.
- Talent Partnerships – link legal migration with development cooperation.
Recommended Reforms
| Measure | Effect |
|---|---|
| Create a one-stop digital portal for migrant workers | Reduces delays and red tape |
| Harmonise labour market access rules for long-term residents | Simplifies employer participation |
| Include integration milestones in residence renewal | Incentivises participation in training and language learning |
🟢 PART VI – Strategic Roadmap for the EU (2025–2035)
To achieve convergence in employment outcomes by 2035, the EU should pursue a three-pillar strategy:
| Pillar | Focus | Key Instruments |
|---|---|---|
| Inclusion | Equal access to work, language, and recognition | ESF+, AMIF funding, integration programmes |
| Empowerment | Education, training, and entrepreneurship | Digital platforms, apprenticeships |
| Accountability | Monitoring and evaluation of integration outcomes | Eurostat indicators, annual progress reviews |
Expected Impact by 2035 (Projected Outcomes)
| Indicator | 2023 | 2035 (Target) |
|---|---|---|
| Employment rate (non-EU citizens) | 61 % | 72 % |
| Unemployment rate (non-EU citizens) | 12.3 % | 7 % |
| Employment gap vs nationals | 13.2 p.p. | ≤ 5 p.p. |
| Female migrant participation | 54 % | 68 % |
| Recognition of foreign qualifications | ~40 % | ≥ 80 % |
🟦 PART VII – Conclusion
The integration of migrants into the EU labour market is not only a moral and social imperative, but also an economic necessity.
Demographic ageing, skill shortages, and global competition require Europe to fully utilise its diverse human capital.
While progress has been made, gaps remain substantial.
Closing these requires a shift from passive migration management to active integration governance — investing in skills, equality, and opportunity.
As the EU enters the next decade, the success of its Migration and Asylum Pact, Green Deal, and Digital Transition will depend on one factor above all:
The full participation of every person living and working in Europe — regardless of origin.